Graphics Editor Statistics Pane
Use the Statistics pane to get information on the performance of your graphics and components:
| Component | Description |
|---|---|
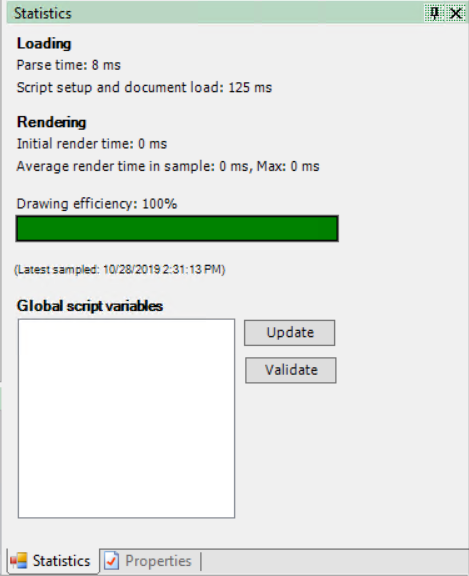
| Loading |
Parse time displays the time it takes to load the graphic file. Small files load quickly whereas large files take longer to load. If the loading process takes too long, consider reducing the number of figures included in the graphic. Script setup and document load display the amount of time it takes to load Script blocks, initiate and start the script engine, and execute the OnDocumentLoad scripts. If this takes too long, you can consider reducing the amount of OnDocumentLoad scripts and the total number of Script blocks in the graphic. Complex OnDocumentLoad scripts delay the opening of the graphic. |
| Rendering |
Initial render time displays the time it takes to draw the graphics file the first time, that is, the time it takes for the system to draw all the graphic figures. The more complex the graphic is, the longer it takes to render. Average render time in sample displays the time it takes to update the graphic in run time. The result is updated every second. The average rendering time and the maximum rendering time are displayed. |
| Drawing efficiency |
The bar indicates the performance of the graphic:
|
| Update |
Click to analyze all the scripts and refresh the view to show all global variables, that is, variables not declared as 'var'. |
| Validate |
Click to analyze the found Global script variables and notify which variables are in conflict with reserved names. |